Week 06 - KITTI Dataset And Multi-Sensor Visualization
Task Goal
This week works with KITTI-style sensor data and ROS2 visualization. The goal is to publish point cloud and image data, then inspect the result with visualization tools.
Folder Check
week6/
|-- README.md          # required report
|-- img/               # visualization image
Environment
- ROS2 Jazzy
- KITTI Raw Dataset
- RViz2
- RQT
- cv_bridge
Steps
- Study the KITTI dataset structure.
- Convert point cloud and image data into ROS2 messages.
- Run the publisher node.
- Inspect the output with RViz2 and RQT.
Commands
ros2 run ros2_kitti_publishers publisher_node
rviz2
rqt
Result
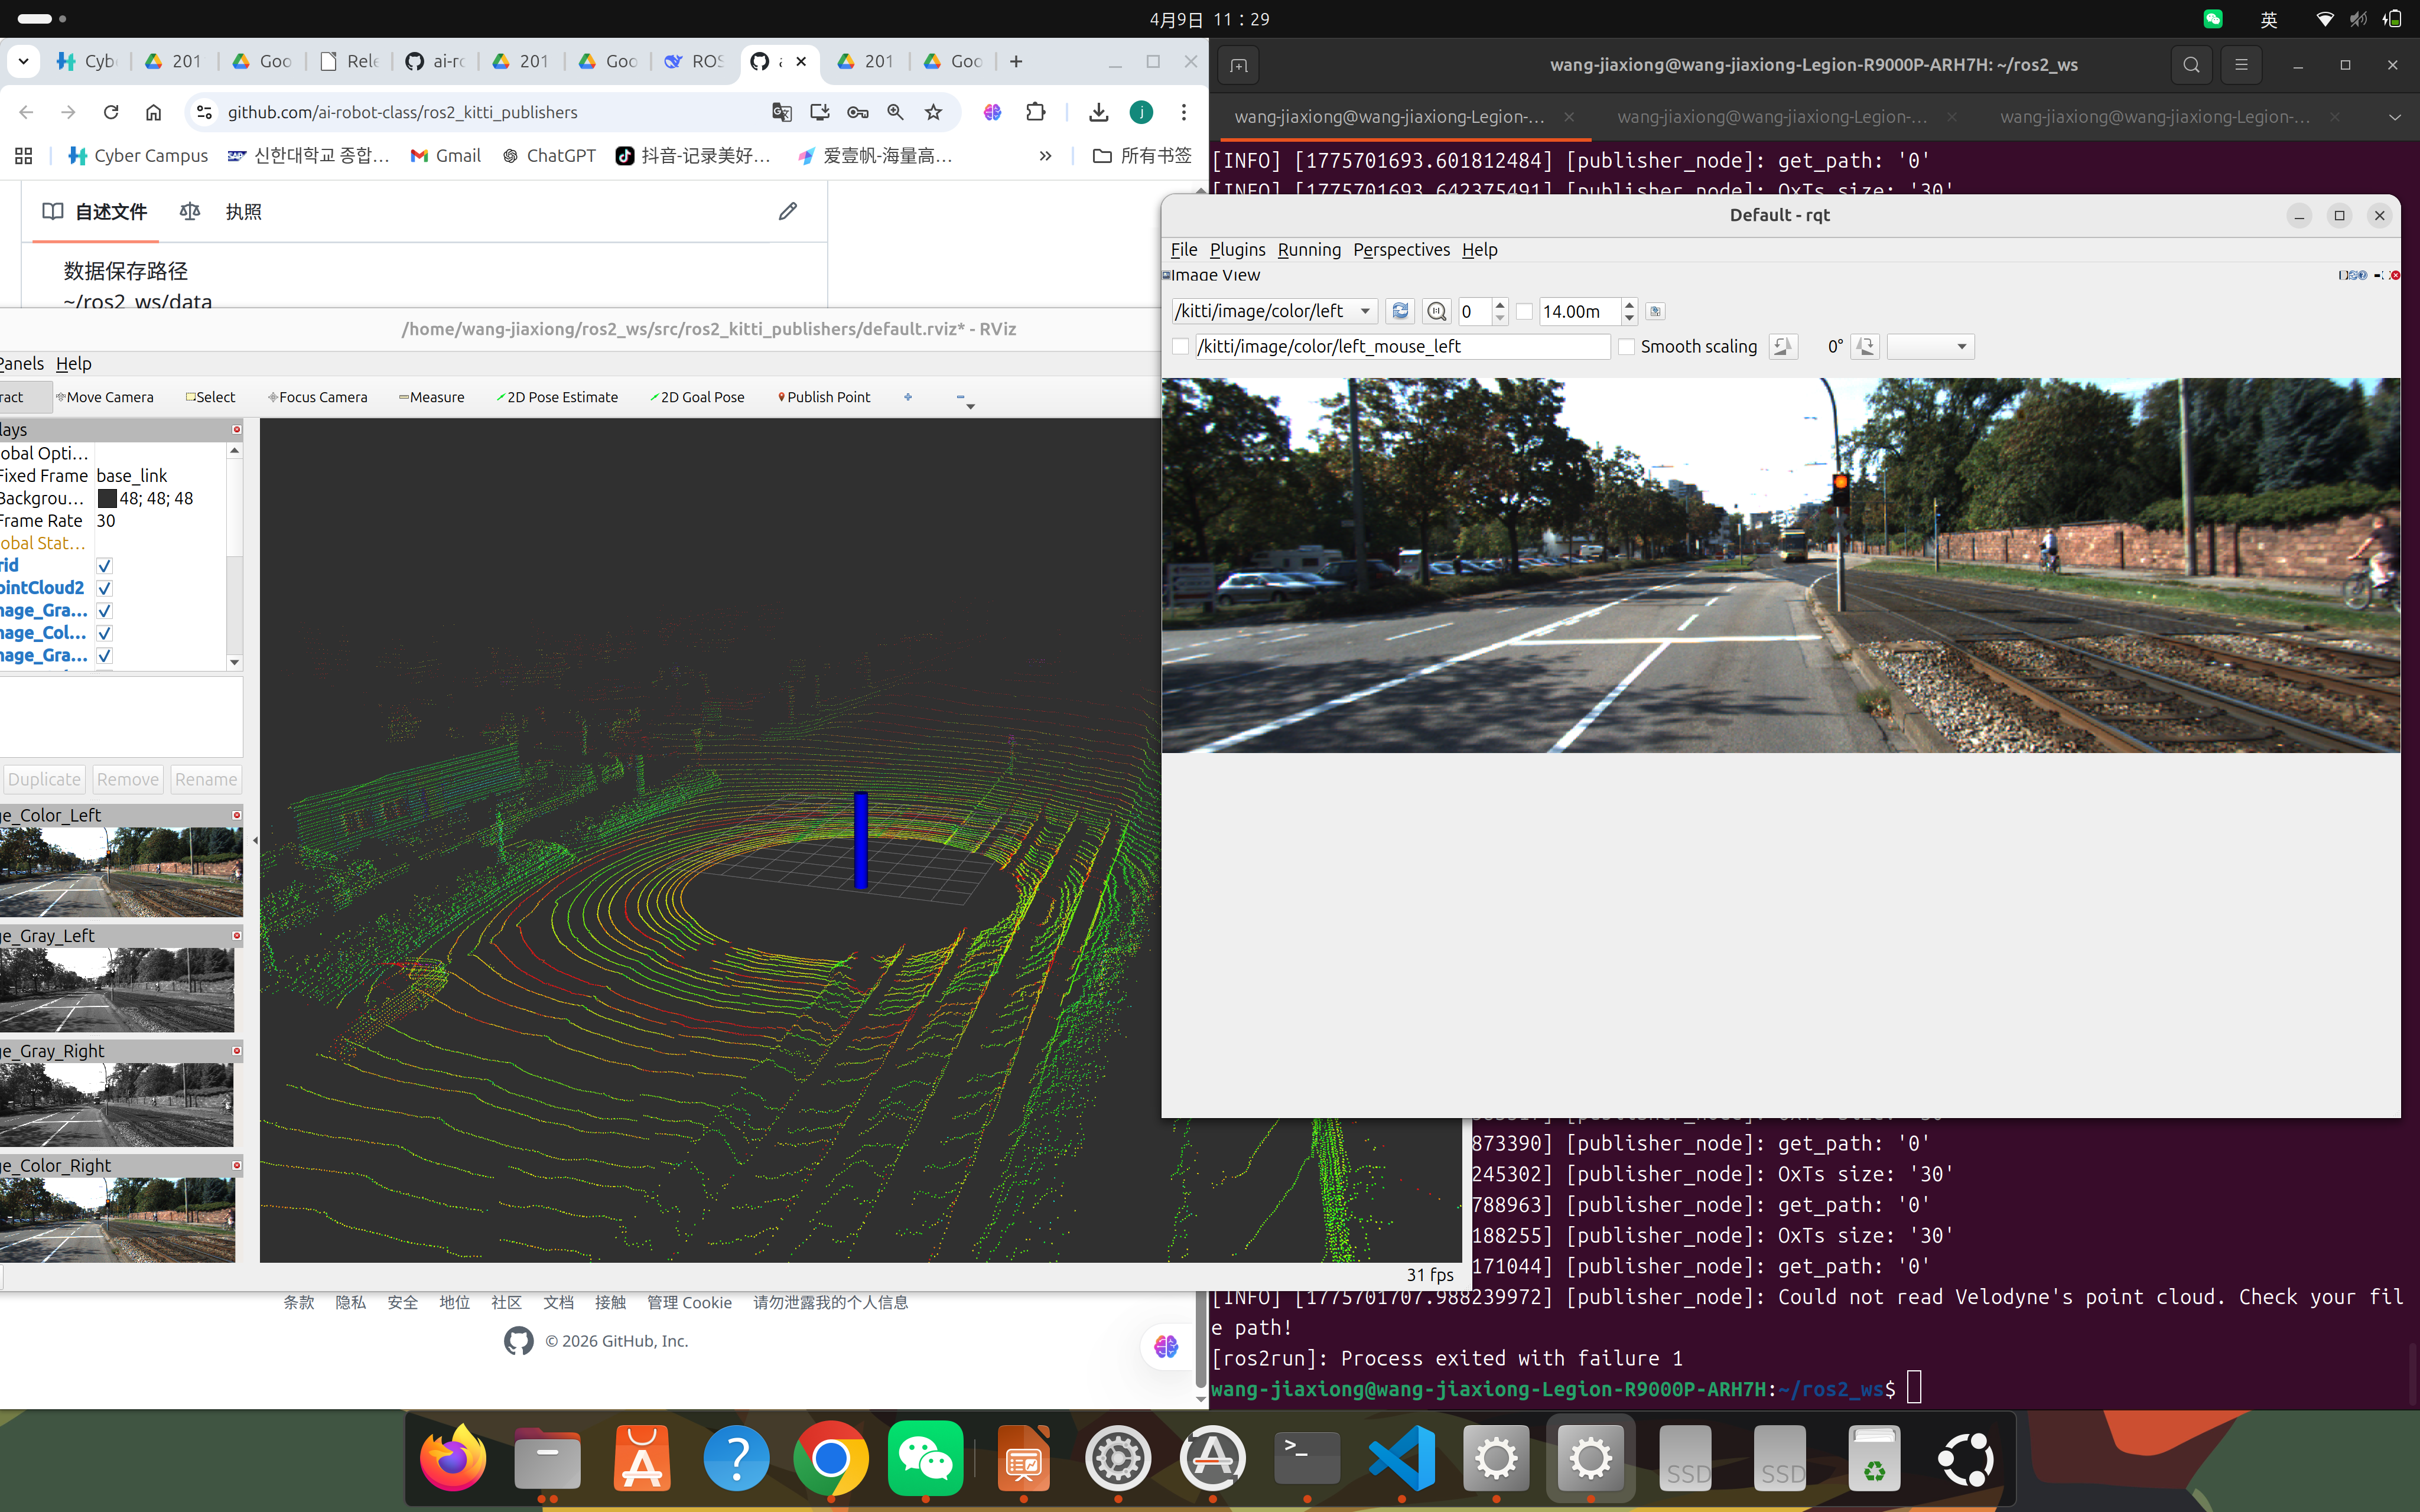
Summary
Multi-sensor visualization is a key robot perception skill. This week strengthens the connection between datasets, ROS2 message types, and visual debugging tools.
遇到的问题与解决
| 问题 | 原因 | 解决方案 |
|---|---|---|
| 环境配置报错 | 依赖版本不兼容 | 查阅官方文档确认版本匹配后重新安装 |
| 命令执行无响应 | 环境变量未加载 | 执行 source 加载 ROS2 环境脚本 |
| 截图无法正常显示 | 图片路径错误 | 检查相对路径,确保文件在正确目录 |
| 代码运行失败 | 缺少依赖包 | 使用 pip install 补全缺失的依赖 |